
enabling multiple in advanced or by geoIP creates huge load times
The support doesn work on Saturdays and Sundays, so some Friday requests can be answered on Monday. If you have problems with registration ask help on contact us page pleaseIf you not got email within 24~36 business hours, firstly check your spam box, and if no any email from the support there - back to the forum and read answer here. DO NOT ANSWER ON EMAILS [noreply@pluginus.net] FROM THE FORUM!! Emails are just for your info, all answers should be published only here.
The support doesn work on Saturdays and Sundays, so some Friday requests can be answered on Monday.
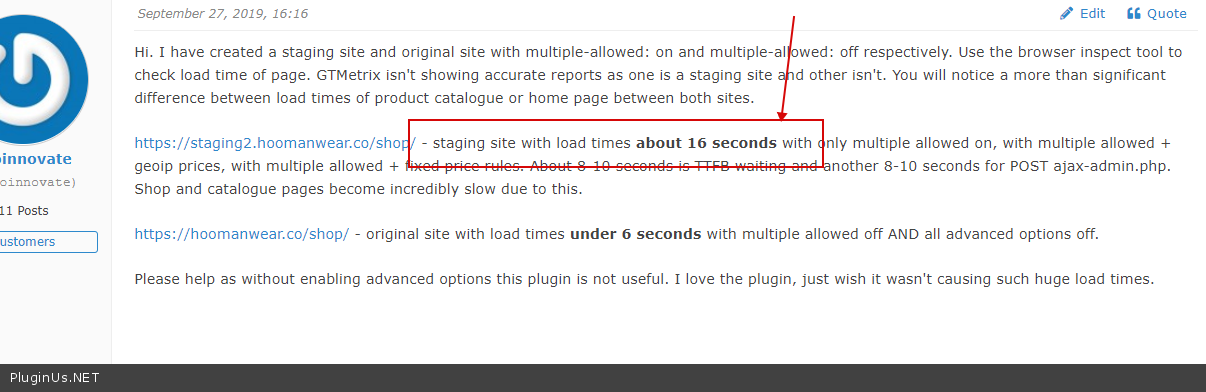
Quote from Proinnovate on September 27, 2019, 16:16Hi. I have created a staging site and original site with multiple-allowed: on and multiple-allowed: off respectively. Use the browser inspect tool to check load time of page. GTMetrix isn't showing accurate reports as one is a staging site and other isn't. You will notice a more than significant difference between load times of product catalogue or home page between both sites.
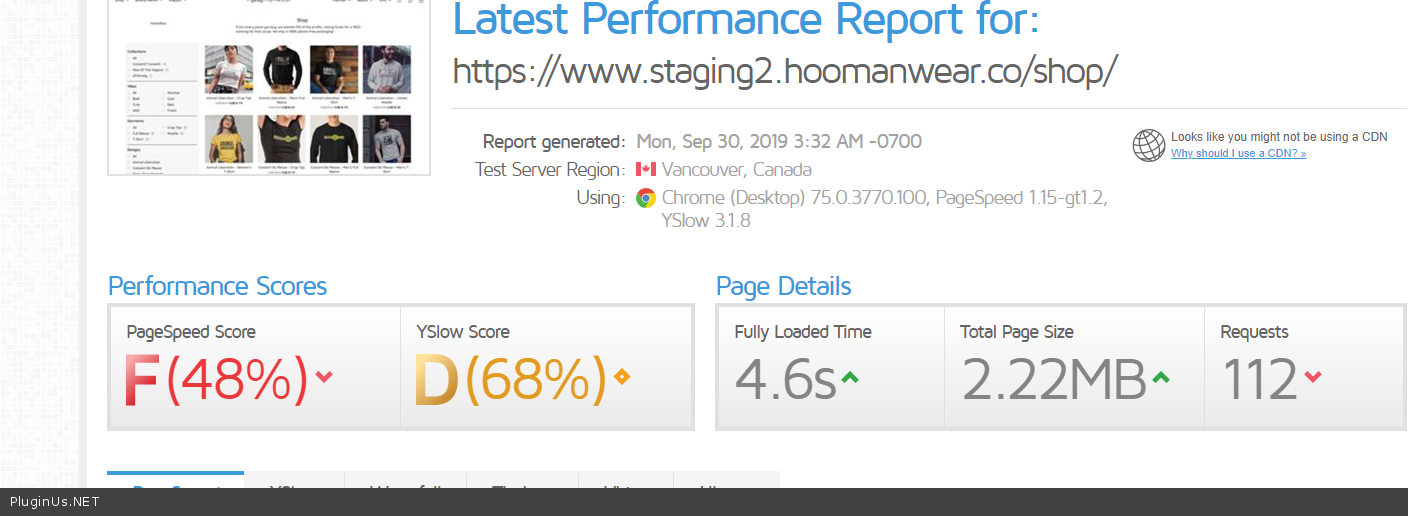
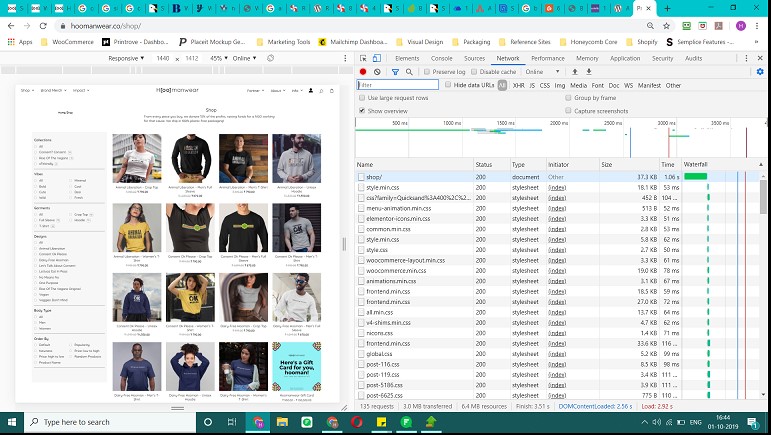
https://staging2.hoomanwear.co/shop/ - staging site with load times about 16 seconds with only multiple allowed on, with multiple allowed + geoip prices, with multiple allowed + fixed price rules. About 8-10 seconds is TTFB waiting and another 8-10 seconds for POST ajax-admin.php. Shop and catalogue pages become incredibly slow due to this.
https://hoomanwear.co/shop/ - original site with load times under 6 seconds with multiple allowed off AND all advanced options off.
Please help as without enabling advanced options this plugin is not useful. I love the plugin, just wish it wasn't causing such huge load times.
Hi. I have created a staging site and original site with multiple-allowed: on and multiple-allowed: off respectively. Use the browser inspect tool to check load time of page. GTMetrix isn't showing accurate reports as one is a staging site and other isn't. You will notice a more than significant difference between load times of product catalogue or home page between both sites.
https://staging2.hoomanwear.co/shop/ - staging site with load times about 16 seconds with only multiple allowed on, with multiple allowed + geoip prices, with multiple allowed + fixed price rules. About 8-10 seconds is TTFB waiting and another 8-10 seconds for POST ajax-admin.php. Shop and catalogue pages become incredibly slow due to this.
https://hoomanwear.co/shop/ - original site with load times under 6 seconds with multiple allowed off AND all advanced options off.
Please help as without enabling advanced options this plugin is not useful. I love the plugin, just wish it wasn't causing such huge load times.
Quote from Proinnovate on September 27, 2019, 19:40Please make sure you check both sites after completely clearing cache. And if you're unable to see the difference, then I have provided you login details for my original site. Kindly login and enable multiple allowed and see the difference after clearing cache.
Please make sure you check both sites after completely clearing cache. And if you're unable to see the difference, then I have provided you login details for my original site. Kindly login and enable multiple allowed and see the difference after clearing cache.
Quote from Proinnovate on September 30, 2019, 12:23Awaiting your response on this. It's a little urgent, please. Also, seems like the staging site may not be functioning properly. So simply visit original site and check load times with multiple enabled setting on and off.
Awaiting your response on this. It's a little urgent, please. Also, seems like the staging site may not be functioning properly. So simply visit original site and check load times with multiple enabled setting on and off.
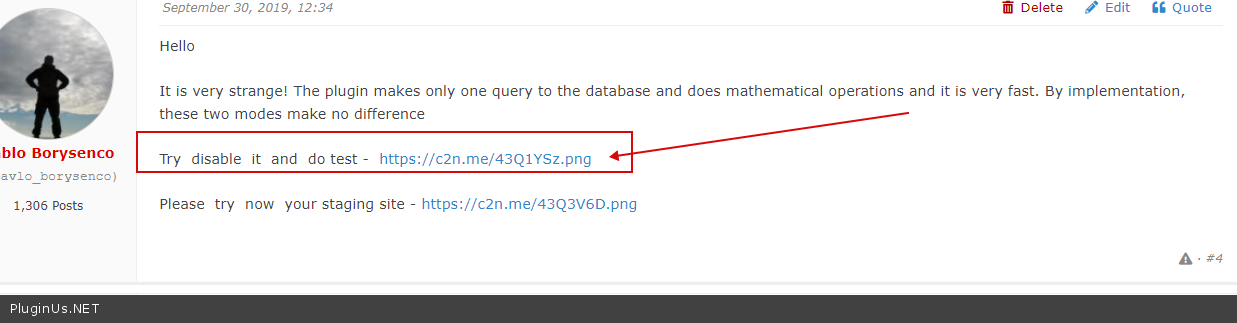
Quote from Pablo Borysenco on September 30, 2019, 12:34Hello
It is very strange! The plugin makes only one query to the database and does mathematical operations and it is very fast. By implementation, these two modes make no difference
Try disable it and do test - https://c2n.me/43Q1YSz.png
Please try now your staging site - https://c2n.me/43Q3V6D.png
Hello
It is very strange! The plugin makes only one query to the database and does mathematical operations and it is very fast. By implementation, these two modes make no difference
Try disable it and do test - https://c2n.me/43Q1YSz.png
Please try now your staging site - https://c2n.me/43Q3V6D.png
Quote from Proinnovate on September 30, 2019, 12:37i disabled "caching on my site option" and tested too. it's still huge load times when any of the advanced options are enabled. Is it because there are too many variants? (some products have upto 150 variants, average is around 60, and there are total 50 products)
I told you the staging site isn't working well. Please only test both conditions on my original site.
i disabled"caching on my site option" and tested too. it's still huge load times when any of the advanced options are enabled. Is it because there are too many variants? (some products have upto 150 variants, average is around 60, and there are total 50 products)
I told you the staging site isn't working well. Please only test both conditions on my original site.
Quote from Proinnovate on September 30, 2019, 12:38The issue is on my original site. Ignore the staging site. Please help me figure out why it's slowing down my original site upon enabling multiple or any other advanced option? You can login and test both conditions.
The issue is on my original site. Ignore the staging site. Please help me figure out why it's slowing down my original site upon enabling multiple or any other advanced option? You can login and test both conditions.
Quote from Proinnovate on September 30, 2019, 16:09Did you observe it? Please respond soon. Thank you.
Did you observe it? Please respond soon. Thank you.
Quote from Proinnovate on October 1, 2019, 10:04I'm stuck with this. I have purchased the plugin, so I would really appreciate you helping out on this. I need to deliver this soon. If this plugin doesn't work properly and you're unable to help me resolve it, I need to do something else. So please, take a look on my original site in multiple on and off conditions and help identify and resolve whatever is causing the issue soon. Thank you.
I'm stuck with this. I have purchased the plugin, so I would really appreciate you helping out on this. I need to deliver this soon. If this plugin doesn't work properly and you're unable to help me resolve it, I need to do something else. So please, take a look on my original site in multiple on and off conditions and help identify and resolve whatever is causing the issue soon. Thank you.
Quote from Pablo Borysenco on October 1, 2019, 12:39Hello
I checked staging site - https://c2n.me/43Rd6JN.png - my test - https://c2n.me/43Q3V6D.png In this case, I can assume that the problem is in your server settings
I did test on main site ( with Is multiple allowed: Yes) - https://c2n.me/43RfFsY - as you can see the difference is only 0.5 seconds
Hello
I checked staging site - https://c2n.me/43Rd6JN.png - my test - https://c2n.me/43Q3V6D.png In this case, I can assume that the problem is in your server settings
I did test on main site ( with Is multiple allowed: Yes) - https://c2n.me/43RfFsY - as you can see the difference is only 0.5 seconds
Quote from Proinnovate on October 1, 2019, 13:16I am repeating myself - don't check the staging site.
Only the original site. And the 5.5 seconds is because it's accessing the site from the cache of the CDN, which you haven't purged. Using GTMetrix won't give accurate data.
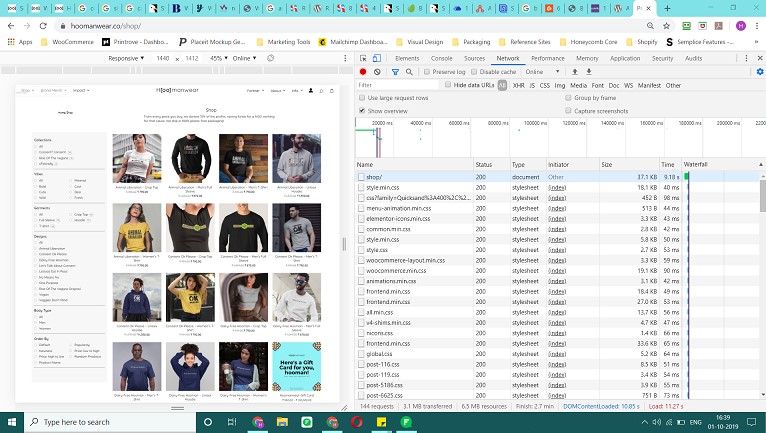
Open https://www.hoomanwear.co/shop/ on your browser with inspect tool and pres CTRL+F5 to reload without cache, it'll show you the real load times. This happens only with multiple enabled - you can see 9.18seconds just for TTFB - https://c2n.me/43RiNtr.jpg
When I disable multiple, this is what it shows - just 1.5 seconds for TTFB https://c2n.me/43RjhmR.jpg
I am not trying to trouble you or fool you. It's really an issue and I request you to please check it the way I've asked you to and you will observe that the issue exists.
I am repeating myself - don't check the staging site.
Only the original site. And the 5.5 seconds is because it's accessing the site from the cache of the CDN, which you haven't purged. Using GTMetrix won't give accurate data.
Open https://www.hoomanwear.co/shop/ on your browser with inspect tool and pres CTRL+F5 to reload without cache, it'll show you the real load times. This happens only with multiple enabled - you can see 9.18seconds just for TTFB - https://c2n.me/43RiNtr.jpg
When I disable multiple, this is what it shows - just 1.5 seconds for TTFB https://c2n.me/43RjhmR.jpg
I am not trying to trouble you or fool you. It's really an issue and I request you to please check it the way I've asked you to and you will observe that the issue exists.
Quote from Proinnovate on October 1, 2019, 20:54If we can plan and be online at the same time, I can show you the issue clearly myself. Else, all you need to do is CTRL + F5 while inspecting the waterfall on your browser with enabled on and off. Kindly repeat CTRL+ F5 a few times after you switch it on as the delay is seen after about 30-40 seconds of changing the setting.
If we can plan and be online at the same time, I can show you the issue clearly myself. Else, all you need to do is CTRL + F5 while inspecting the waterfall on your browser with enabled on and off. Kindly repeat CTRL+ F5 a few times after you switch it on as the delay is seen after about 30-40 seconds of changing the setting.
Quote from Proinnovate on October 1, 2019, 22:38Multiple enabled: https://gtmetrix.com/reports/www.hoomanwear.co/N9SAepgI
Multiple disabled: https://gtmetrix.com/reports/www.hoomanwear.co/sCNBqiHb
I have generated both reports after clearing server and CDN cache before running each test. If you like, I will give you access to my CDN and you can purge cache from it along with dynamic and static cache from my siteground server. You will then observe the results as above.
The admin-ajax.php is the major differentiator between both. It's what shows to be responding with the appropriate currency values and has long loading times when multiple is enabled. Please see both reports carefully. Thank you. Please WhatsApp Call/Text me on number mentioned in private data next time you are testing so I can guide you in recreating the issue for you to observe it. I really love your plugin and I appreciate your help in understanding and resolving my issue. Hope to get this sorted soon.
Multiple enabled: https://gtmetrix.com/reports/www.hoomanwear.co/N9SAepgI
Multiple disabled: https://gtmetrix.com/reports/www.hoomanwear.co/sCNBqiHb
I have generated both reports after clearing server and CDN cache before running each test. If you like, I will give you access to my CDN and you can purge cache from it along with dynamic and static cache from my siteground server. You will then observe the results as above.
The admin-ajax.php is the major differentiator between both. It's what shows to be responding with the appropriate currency values and has long loading times when multiple is enabled. Please see both reports carefully. Thank you. Please WhatsApp Call/Text me on number mentioned in private data next time you are testing so I can guide you in recreating the issue for you to observe it. I really love your plugin and I appreciate your help in understanding and resolving my issue. Hope to get this sorted soon.
Quote from Pablo Borysenco on October 2, 2019, 11:26Hello
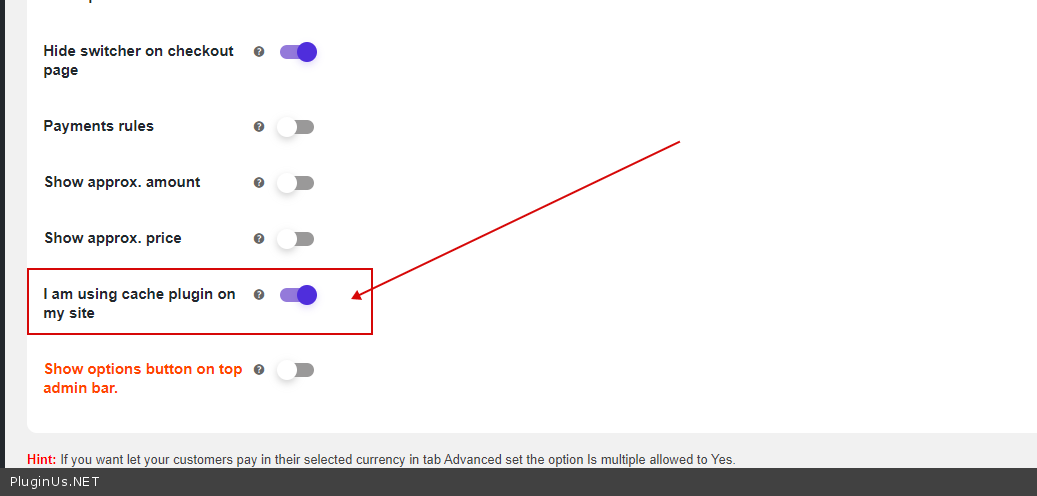
Have you watched my previous video? I deleted this cache - https://c2n.me/43Snhp5.png ( if you try to watch my video you will see it ) I disabled the plugin at all!
CTRL+ F5 for GTmetrix - ????
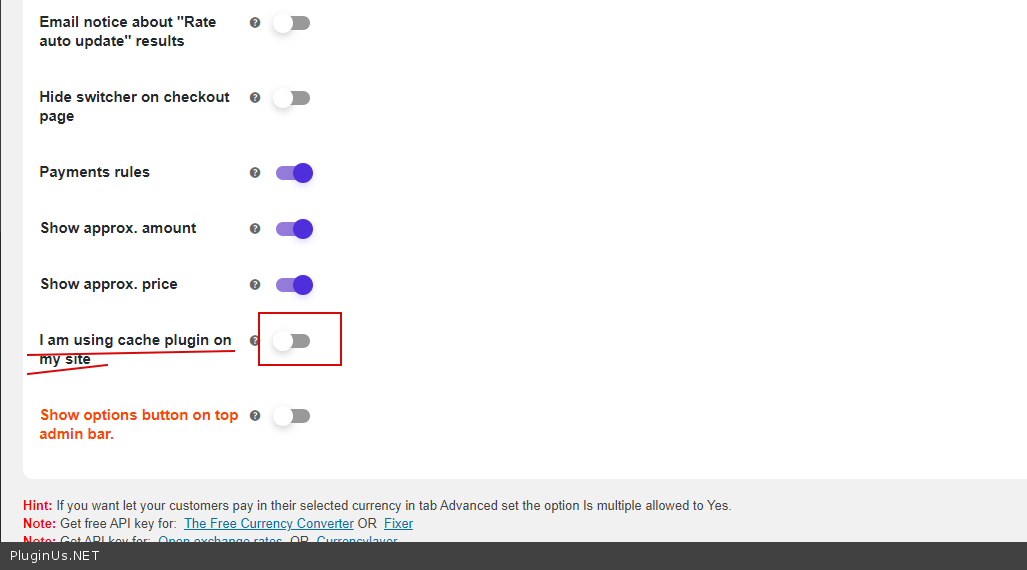
Your settings - https://c2n.me/43SmbK0.png - My message - https://c2n.me/43Smiqm.png - Please follow the recommendations and do the test.
this function does not make any ajax requests - https://c2n.me/43SmXaM.png
new video - https://c2n.me/43SoiGr - Please watch it carefully.
Hello
Have you watched my previous video? I deleted this cache - https://c2n.me/43Snhp5.png ( if you try to watch my video you will see it ) I disabled the plugin at all!
CTRL+ F5 for GTmetrix - ????
Your settings - https://c2n.me/43SmbK0.png - My message - https://c2n.me/43Smiqm.png - Please follow the recommendations and do the test.
this function does not make any ajax requests - https://c2n.me/43SmXaM.png
new video - https://c2n.me/43SoiGr - Please watch it carefully.
Quote from Proinnovate on October 2, 2019, 11:51I was unable to show this to you properly earlier - here it is. This is what I meant by using the inspect tool on the browser to observe. Are you able to recreate this and see it too? https://c2n.me/43SqYxJ
I was unable to show this to you properly earlier - here it is. This is what I meant by using the inspect tool on the browser to observe. Are you able to recreate this and see it too? https://c2n.me/43SqYxJ
Quote from Pablo Borysenco on October 3, 2019, 10:58Hello
Ок!
Can I deactivate plugins/theme to test?
Hello
Ок!
Can I deactivate plugins/theme to test?
Quote from Proinnovate on October 3, 2019, 10:59Yes sure go ahead.
Yes sure go ahead.
Quote from Pablo Borysenco on October 3, 2019, 13:19Hello
I did test on my cheap test-server(without any cache) - https://c2n.me/43TPr9f
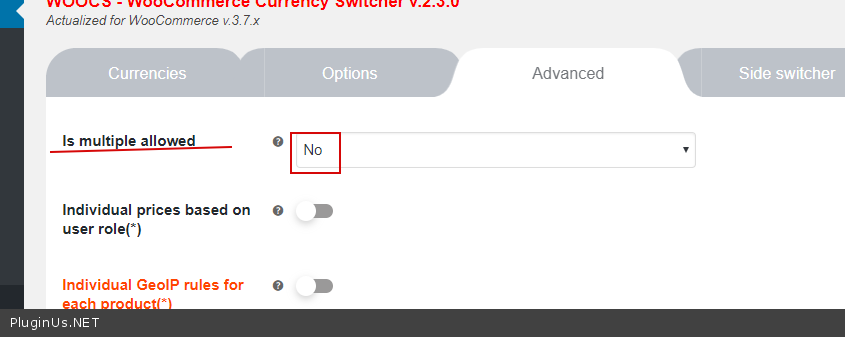
I don’t know why your server is loading so long. in functionality, these options( https://c2n.me/43TQaXK.png ) do not differ and the plugin performs the same function
You can request refund here https://
themeforest.net/refund_ requests/new
Hello
I did test on my cheap test-server(without any cache) - https://c2n.me/43TPr9f
I don’t know why your server is loading so long. in functionality, these options( https://c2n.me/43TQaXK.png ) do not differ and the plugin performs the same function
You can request refund here https://
Quote from Proinnovate on October 3, 2019, 13:32What could be the possible issues? I really want to be able to use this plugin. Can you please have someone else also take a look and find out what's going wrong?
What could be the possible issues? I really want to be able to use this plugin. Can you please have someone else also take a look and find out what's going wrong?
Quote from Proinnovate on October 3, 2019, 13:35Is there a possibility of deleting the plugin and all it's data, reinstalling it and then seeing if it works correctly? If yes, I can give you access to my database for you to check that? Or i can do it myself if you guide me.
Is there a possibility of deleting the plugin and all it's data, reinstalling it and then seeing if it works correctly? If yes, I can give you access to my database for you to check that? Or i can do it myself if you guide me.
Quote from Proinnovate on October 3, 2019, 22:20Hi I was finally able to locate the issue/conflict. The conflict is most probably with the Memory Caching (Memcached) feature of Siteground Optimiser.
I say probably because with Memcaching off, the delay reduces only by 5 seconds, whereas with multiple: no, the reduction is almost 9 seconds. Here's the avg results:
Memcaching: Off & Multiple: No - about 1.5 seconds
Memcaching: On & Multiple: No - 2 seconds or lesser
Memcaching: On & Multiple: Yes - 10 seconds or more
Memcaching: Off & Multiple: Yes - about 5 seconds
SG Optimiser: Deactivated & Multiple: Yes - about 5 seconds
Memcaching: On & WOOCS: Deactivated - 2 seconds or lesser
These results are consistent.
I rolled back SG Optimiser 1, 2 and 3 versions up to a date even before I installed and used WOOCS - but the result stayed the same.
The issue definitely seems to be between your plugin and SG Optimiser. But since with Multiple No, I'm getting the best load times with memcached on, it feels like the Memcached is working correctly.
I hope this helps you look in the right place as to whatever is causing the issue. Let me know. Thank you.
Memcached setting is in SG Optimiser.
Hi I was finally able to locate the issue/conflict. The conflict is most probably with the Memory Caching (Memcached) feature of Siteground Optimiser.
I say probably because with Memcaching off, the delay reduces only by 5 seconds, whereas with multiple: no, the reduction is almost 9 seconds. Here's the avg results:
Memcaching: Off & Multiple: No - about 1.5 seconds
Memcaching: On & Multiple: No - 2 seconds or lesser
Memcaching: On & Multiple: Yes - 10 seconds or more
Memcaching: Off & Multiple: Yes - about 5 seconds
SG Optimiser: Deactivated & Multiple: Yes - about 5 seconds
Memcaching: On & WOOCS: Deactivated - 2 seconds or lesser
These results are consistent.
I rolled back SG Optimiser 1, 2 and 3 versions up to a date even before I installed and used WOOCS - but the result stayed the same.
The issue definitely seems to be between your plugin and SG Optimiser. But since with Multiple No, I'm getting the best load times with memcached on, it feels like the Memcached is working correctly.
I hope this helps you look in the right place as to whatever is causing the issue. Let me know. Thank you.
Memcached setting is in SG Optimiser.